This document aims to represent the level of participation in ReSECT, according to the profile of users and healthcare centres involved, taking into account the geographical distribution and main healthcare metrics.
The total number of professionals with a validated ReSECT pre-registration are accounted for this document. Some of these professionals may not have activated their ReSECT user account.
The following figures assume that changes in user´s work centre are duly communicated. The professional category of each user is determined by the pre-registration form. Professional category, in the case of residents, is automatically updated to FEA every June if 5 years have passed since the start of their residency.
Users by Department
Code
formulario %>%
  group_by (HOSPITAL=hospital) %>%
  summarise (USERS=n()) %>%
  arrange(desc(USERS)) %>%
  ggplot(aes(x=fct_reorder(HOSPITAL, USERS), y=USERS)) +
    geom_col(fill = color1) +
    coord_flip()+
    scale_y_continuous(breaks = seq(1,15))+
    theme_minimal()+
    theme(
      axis.text.y = element_text(size = 5)
    )+
  labs(x=NULL, y="\nUsers")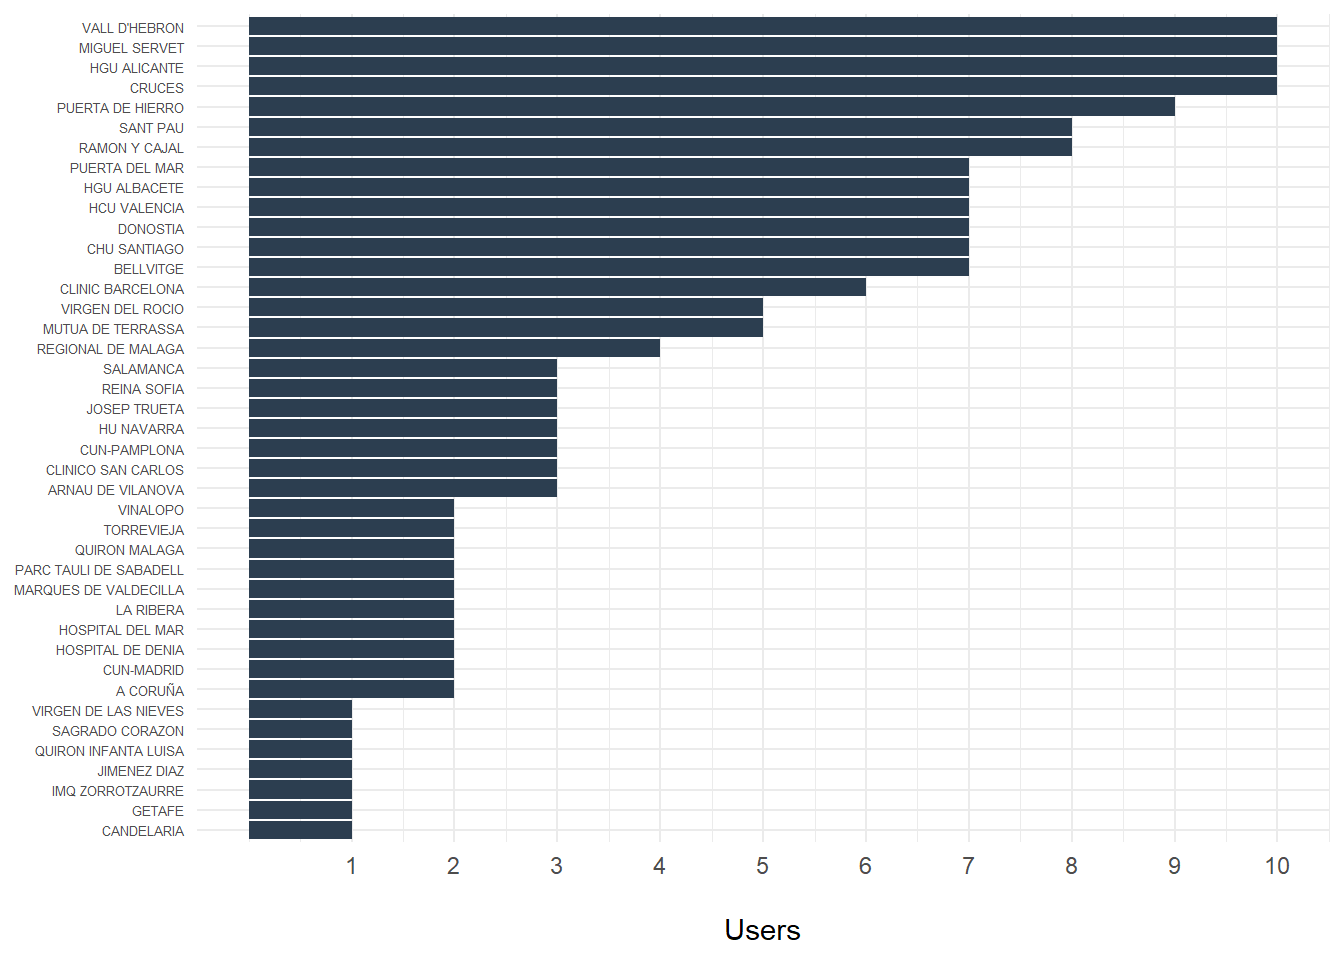
Code
  # datatable(extensions = 'Buttons', options = list(
  #   dom = 'lftBip',
  #   buttons = list(list(
  #       extend = 'collection',
  #       buttons = c('csv', 'excel', 'pdf'),
  #       text = 'Download'))))
User Profile
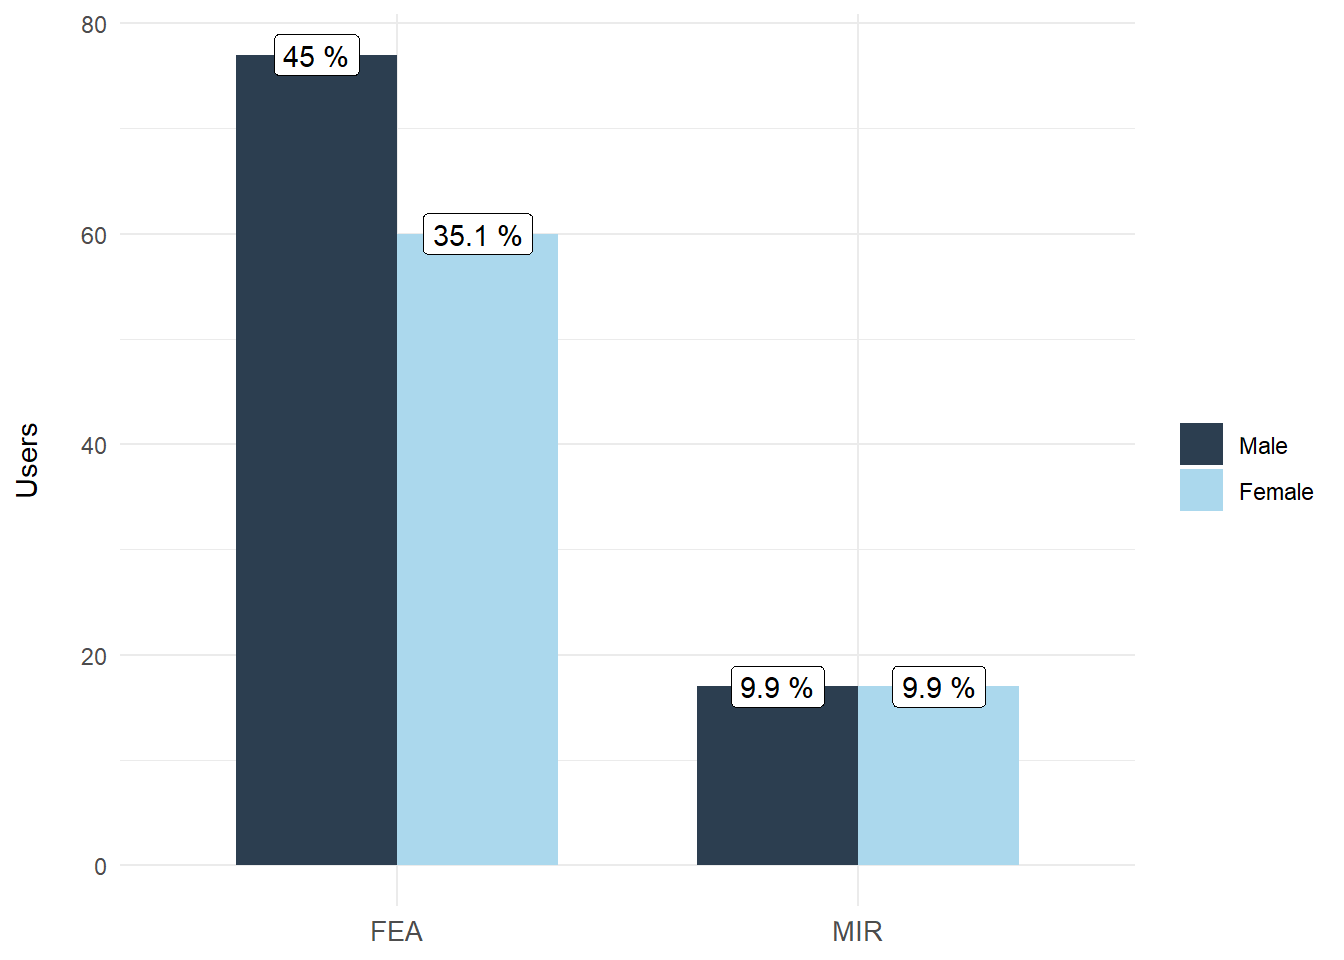
Position and Gender
Code
formulario$categoria <- substr(formulario$categoria, 1, 3)
formulario$categoria <- as.factor(formulario$categoria)
formulario$categoria <- fct_recode(formulario$categoria, Resident = "MIR", Specialist = "FEA")

formulario$categoria_actual <- case_when(
  year(Sys.Date()) - formulario$inicio_mir <= 4 ~ "MIR",
  month(Sys.Date()) < 6 & (year(Sys.Date()) - formulario$inicio_mir == 5) ~ "MIR",
  month(Sys.Date()) >= 6 & (year(Sys.Date()) - formulario$inicio_mir == 5) ~ "FEA",
  year(Sys.Date()) - formulario$inicio_mir >5 ~ "FEA"
 ) %>% as.factor()


formulario %>%
  ggplot(aes(x = categoria_actual, fill=sexo, group=sexo)) +
  geom_bar(width = 0.7, position = position_dodge(0.7))+
  geom_label(aes(label=paste(round(after_stat(100*..count../sum(..count..)),1),"%")), fill="white",stat="count", position = position_dodge(0.7))+
  scale_fill_manual(values = c(color1, color2), labels = c("Male", "Female"))+
  labs(y = "Users\n", x = NULL, fill = NULL) +
  theme_minimal() +
  theme(
    axis.text.x = element_text(size = 10)

  )
Experience and Gender
Code
formulario <- formulario %>% mutate(experiencia = as.numeric(year(Sys.Date()))- as.numeric(formulario$inicio_mir))

temp <- formulario %>% group_by(experiencia, sexo) %>%
  summarise(usuarios = n()) %>%
  arrange(experiencia)


temp  %>% ggplot(aes(x = experiencia, y = usuarios, fill = sexo)) +
  geom_col() +
  scale_fill_manual(values = c(color1, color2), labels = c("Male", "Female"))+
  theme_minimal() +
labs(x = "Experience", y ="Users", caption ="Years of experience since the start of the period as a resident", fill = NULL) 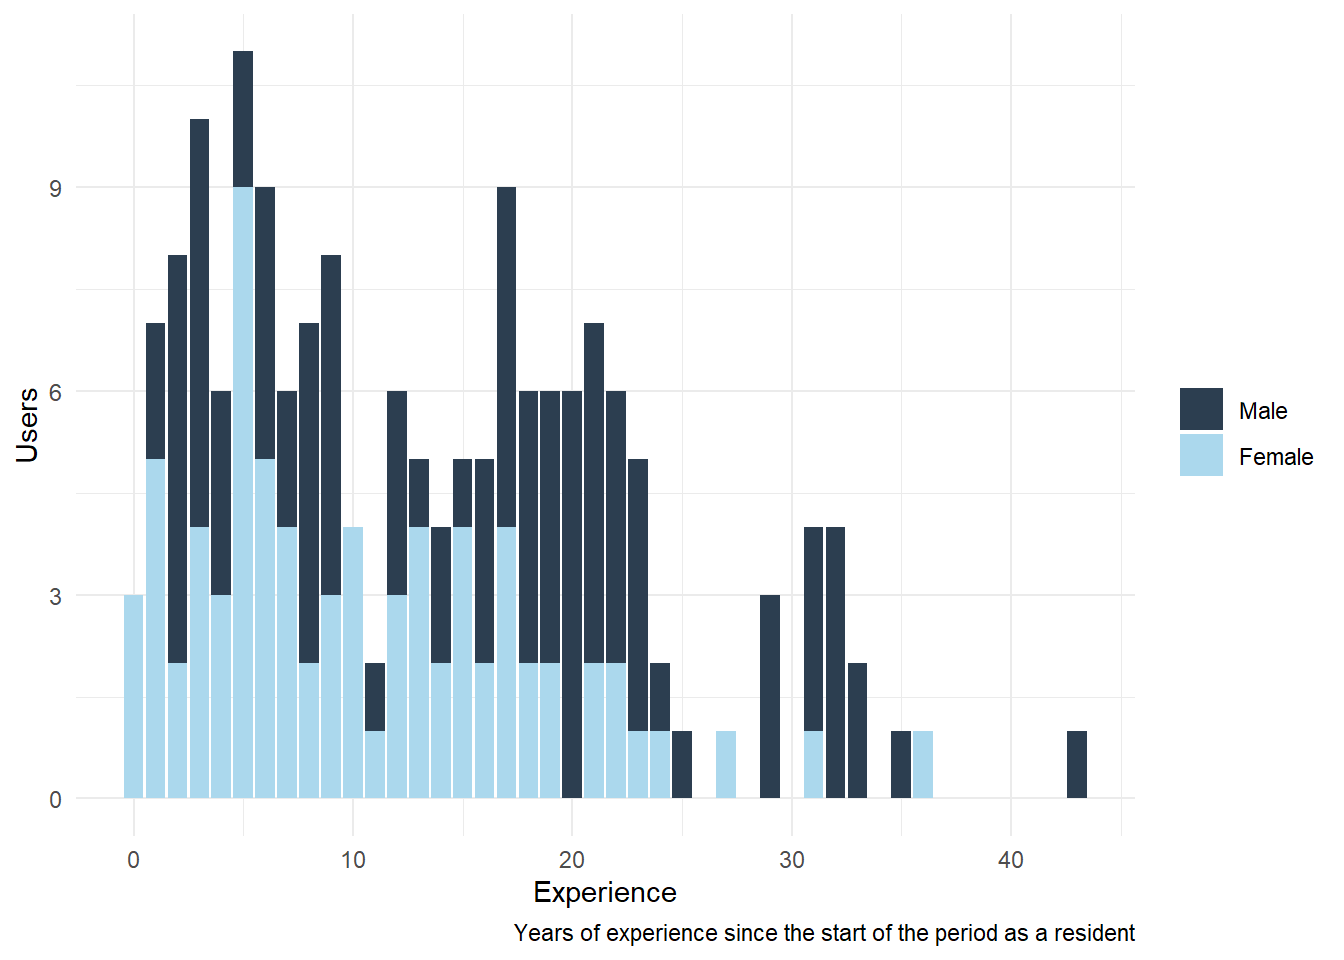
Residents by Department
Code
temp <- formulario %>% mutate(mir = ifelse(categoria_actual=="MIR", 1,0)) %>% group_by(hospital) %>% summarise(
  users = n(),
  mir = sum(mir),
  percent_mir = round(100 * mir / users, 1)) %>% arrange(desc(users))

temp %>% filter(mir>0) %>% ggplot(aes(x = fct_reorder(hospital, percent_mir), y=percent_mir)) +
  geom_col(fill = color1, width = 0.5)+
  geom_label(aes(label=mir), size = 2.5, label.size = 1, color = color1) +
  coord_flip()+
  scale_y_continuous(limits = c(0,100))+
  theme_minimal()+
  theme(
    axis.text.y = element_text(size=8))+
  labs(x=NULL, y="Resident Users (%)", caption = "Labels show number of residents")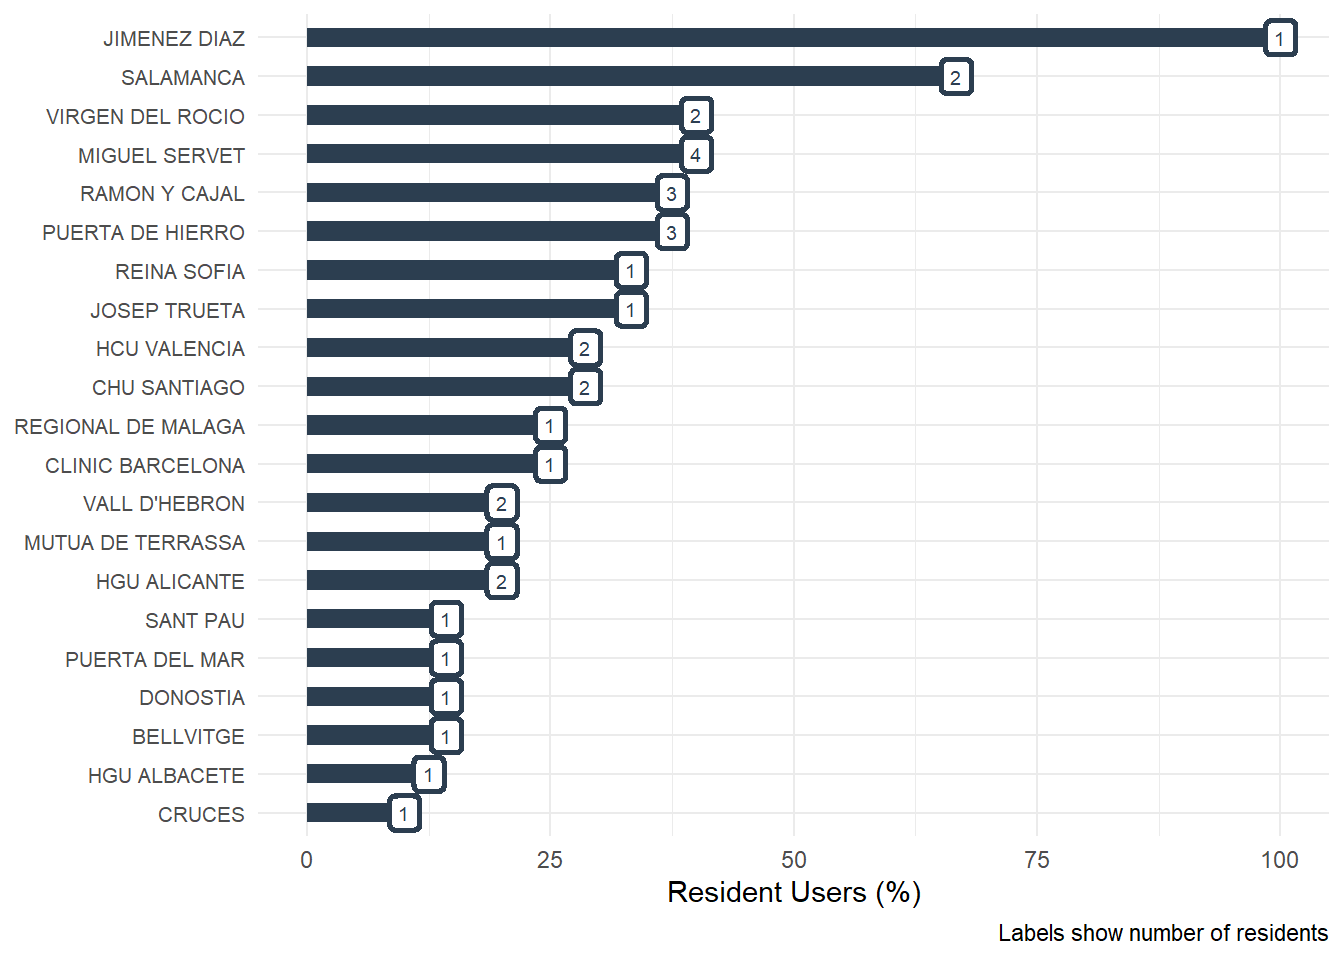
Centres
Activation Date
List of centers activated for the process of anatomic lung resections with their respective dates of incorporation.
Due to the prospective nature of the ReSECT processes, date of surgical intervention of the patients recruited at each centre must be after the respective activation dates.
Code
Code
  # datatable(extensions = 'Buttons', options = list(
  #   dom = 'lftBip',
  #   buttons = list(list(
  #       extend = 'collection',
  #       buttons = c('csv', 'excel', 'pdf'),
  #       text = 'Download'))))
Geographical Distribution
Code
(mapa <- leaflet(hospitales) %>%
  setView(lng = 0, lat = 40, zoom = 5.5) %>%
  addTiles() %>%
  addProviderTiles("OpenStreetMap", group = "OpenStreetMap") %>%
  addMarkers(~long, ~lat, label = ~as.character(hospital)))
Code
library(htmlwidgets)
saveWidget(mapa, file="mapa.html")
Code
Code
    # arrange(desc(USERS)) %>%
    # datatable(extensions = 'Buttons',
    #         options = list(
    #             dom = 'lftBip',
    #             buttons = list(list(
    #                 extend = 'collection',
    #                 buttons = c('csv', 'excel', 'pdf'),
    #                 text = 'Download'))))
Type of Centre
National Catalogue of Hospitals 2022 (Ministry of Health)
Code
hospitales %>%
    select(
      CENTRE = hospital,
      BEDS = camas,
      DEPENDENCY = dependencia,
      AGREEMENT = concierto) %>%
    arrange(desc(BEDS)) %>%
  reactable(
    defaultSortOrder = "desc",
    defaultSorted = c("BEDS")
  )
Code
  # datatable(extensions = 'Buttons', options = list(
  #   dom = 'lftBip',
  #   buttons = list(list(
  #       extend = 'collection',
  #       buttons = c('csv', 'excel', 'pdf'),
  #       text = 'Download'))))
Participation in Figures
Number of users: 175 professionals, of which NA % are female and NA % are residents.
Users from 41 centres in 29 cities and 20 provinces are participating.
The mean of users by department is 4.3 professionals.
Public centres 80%. Number of beds: mean (723), median (740), range (72 - 1525)
Number of centres activated in the process of anatomical lung resections: 40 departments.